MLOps Blueprint & Operational Strategy
"It's not enough to build the model. You have to build the system that builds, validates, deploys, monitors, and replaces the model. The model is the easy part."
Why This Matters
The academic framing of machine learning focuses on models: algorithms, loss functions, evaluation metrics. The production reality is almost the opposite: models are the smallest source of failure. The system around the model — the pipelines, the infrastructure, the monitoring, the retraining loops — is where production ML projects succeed or die.
Three data points define the problem:
-
Technical debt in ML systems compounds faster than in standard software. Sculley et al.'s landmark 2015 NeurIPS paper "Hidden Technical Debt in Machine Learning Systems" identified that ML systems have all the sources of standard software debt plus unique ML-specific debt: data dependency debt, feedback loop entanglement, pipeline glue code, and configuration debt. A system that works on day one with no explicit MLOps design will be deeply difficult to maintain by month six. [Sculley et al., NeurIPS 2015]
-
The gap between prototyping and production is primarily operational, not technical. Google's internal study of ML production deployments found that the ratio of model code to pipeline and infrastructure code is typically 5:95 — that is, the model is roughly 5% of the total codebase. The other 95% is the system around the model. Teams that are surprised by this ratio are teams that did not plan for operations. [Sculley et al., NeurIPS 2015]
-
Silent failures are the dominant failure mode. Unlike software, where a bug usually produces an error, ML system failures often produce valid-looking but wrong outputs. Prediction quality degrades. The model serves stale patterns. The feature pipeline silently introduces skew. None of these raise an exception. They are visible only through deliberate monitoring. The 2024 State of MLOps survey found that 67% of teams discovered model quality issues first through business metric degradation — not through ML monitoring — meaning the system was failing for weeks or months before anyone noticed. [Weights & Biases MLOps Survey, 2024]
These three facts lead to one conclusion: MLOps discipline is not optional engineering overhead. It is the investment that separates ML systems that improve over time from ML systems that silently decay.
The Three Moving Parts — A Diagnostic Framework
Traditional software has one moving part: code. ML systems have three: code, data, and model. This is not a philosophical distinction — it has direct engineering consequences for how you design, test, deploy, and monitor ML systems.

Code changes when engineers update pipelines, feature transforms, serving logic, or infrastructure. These changes are tracked in version control and testable in CI.
Data changes when the distribution of incoming data shifts, when the feature pipeline is modified, when upstream data sources change their schema or volume, or when labels become stale. These changes are often invisible to the code layer — no deployment happens, no diff exists.
Model changes when a retraining run produces a new artifact with different weights, thresholds, or calibration. The new model may behave identically on average but differently on important edge cases.
Any of the three can break a production ML system. The failure is hardest to debug when two or three change simultaneously without coordinated versioning.
Think about it: A search ranking model has been running in production for four months with stable business metrics. On a Tuesday morning, the product team reports that click-through rate dropped 12% over the previous 48 hours. The data engineering team confirms "we didn't change any pipelines." The platform team confirms "no code was deployed to the serving layer." The ML team confirms "no retraining ran." How is this possible? Walk through:
- How all three statements can be true while something still changed
- The three most likely sources of the degradation, ranked by probability
- The order in which you would investigate, and what you would look for at each step
Expert thinking
How all three statements are true:
All three statements can be true because they describe intentional changes made by those teams. None of them captures unintentional change — and unintentional change is the dominant failure mode in ML systems.
"We didn't change any pipelines" does not mean the data that flows through the pipelines is unchanged. "No code was deployed" does not mean the serving environment is identical. "No retraining ran" does not mean the model's effective performance is the same.
Three most likely sources, ranked:
-
Data distribution shift (most likely): Something upstream of the feature pipeline changed — a new product launch changed user behavior, a seasonal pattern shifted query distribution, or a new traffic source brought a different user population. The pipeline code is unchanged. The data flowing through it is not. This is the most common silent failure in search and recommendation systems. User behavior is non-stationary; models trained on historical distributions degrade as the present diverges from the past.
-
Feature computation staleness or upstream schema change: A data source the feature pipeline reads from changed its schema, started returning null values for some fields, or began emitting data with a different timestamp granularity. The pipeline did not error — it handled the change gracefully but silently. The features the model receives at serving time are now subtly different from what the model was trained on. This is training-serving skew manifesting through data change, not code change.
-
Serving environment change (less likely but possible): Library versions in the serving container were updated as part of a security patch cycle without a full deployment. A dependency update changed floating-point rounding behavior in a feature computation. The effect is model outputs shifting slightly in distribution. This is rare but has been documented in production systems where container rebuilds happen on a schedule independent of model deployments.
Investigation order:
-
Check monitoring data first: Look at input feature distributions over the past 48 hours vs the prior 30-day baseline. If any feature's distribution shifted significantly (PSI > 0.1 for continuous, chi-square for categorical), you have found the data change. This takes minutes if monitoring is in place.
-
Check upstream data sources: Pull the raw data volumes and schema from each upstream source for the affected period. Look for anomalies: dropped fields, changed cardinality, volume spikes or drops. Compare to the same time window last week.
-
Check model output distributions: Have model output scores shifted? A shift in the distribution of predicted relevance scores — even if individual predictions look plausible — indicates either data change or model behavior change.
-
Check the serving environment: If the first three are clear, look at serving container build times, dependency audit logs, and whether any automated security updates touched ML dependencies.
The meta-lesson: "Nothing changed" is almost never accurate — it means "nothing that was monitored and attributed to our team changed." The 48-hour window narrows the search; the feature distribution analysis usually resolves it within an hour.
Self-assessment checklist:
- Did you consider data distribution shift as a candidate before code or model change?
- Did you distinguish intentional changes (covered by the team statements) from unintentional changes (not covered)?
- Did you propose feature distribution monitoring as the first investigation step?
- Did you connect training-serving skew to the upstream data change scenario?
The End-to-End MLOps Lifecycle
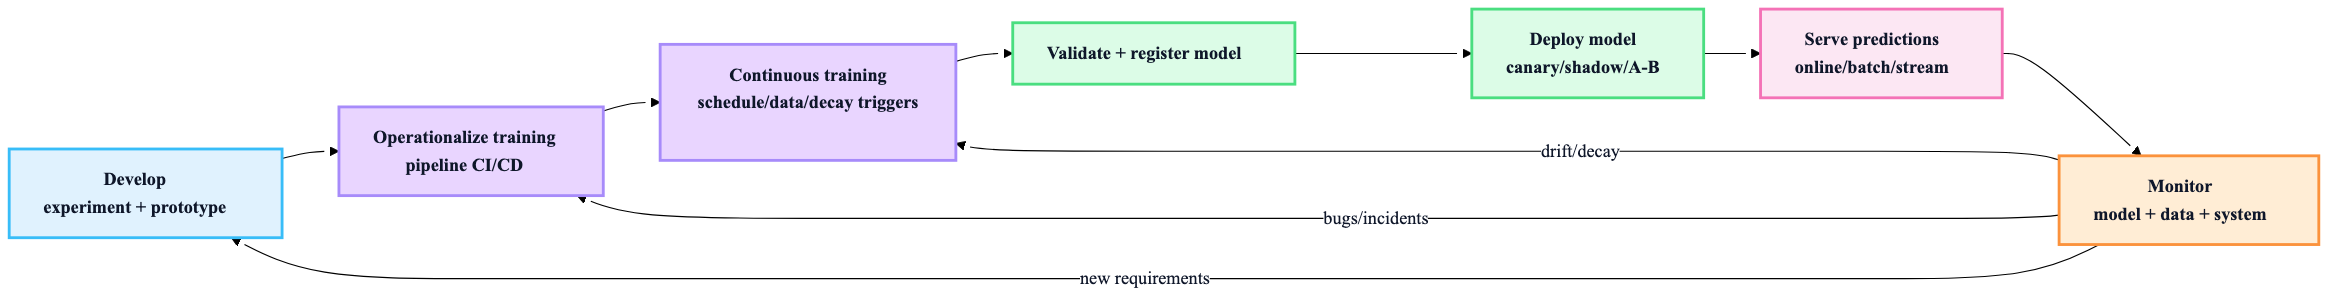
The seven stages of production ML are not a linear pipeline. They form a feedback loop where Stage 7 (Monitor) routes back to Stage 3, Stage 2, or Stage 1 depending on what the monitoring surfaces. Every stage's failure mode is distinct, and the most expensive failures are the ones caught late.
| Stage | Failure mode if skipped or weak |
|---|---|
| 1 — Develop | Build the wrong model for the wrong problem |
| 2 — Operationalize | Notebook works; pipeline fails; reproducibility is lost |
| 3 — Train continuously | Model stales; retraining is manual and inconsistent |
| 4 — Validate and register | Bad model promoted; no rollback baseline |
| 5 — Deploy | Full-traffic failure; no progressive rollout; no rollback plan |
| 6 — Serve | Latency violations; serving-training skew; no versioning |
| 7 — Monitor | Silent decay; business impact discovered weeks late |
The feedback loops from Stage 7 are where operational maturity compounds. A team that has Stage 7 connected to Stage 3 detects drift and triggers retraining automatically. A team without Stage 7 discovers failures from angry stakeholders.
The Five Operating Principles
Each principle below addresses a specific, documented failure mode. Understanding the failure mode is what makes the principle stick.
Automation: The failure mode without it is hero dependency — one engineer who knows how to run the retraining notebook. When they are unavailable, retraining doesn't happen. When they leave, the process is lost. Automation converts hero knowledge into reproducible code.
Reproducibility: The failure mode without it is unrecoverable state. "We need to redeploy the model from six weeks ago" is a crisis when the model cannot be reconstructed. Versioning six things together — code, data, features, params, environment, artifact — turns a crisis into a five-minute operation.
Continuous CI/CD/CT/CM: The failure mode without each:
- Without CI: code bugs reach training; data bugs reach the model
- Without CD: deployment is slow, error-prone, and undocumented
- Without CT: the model stales silently until manual intervention
- Without CM: degradation is discovered through business impact, not monitoring
Comprehensive testing: The failure mode without data tests is the subtlest: the model trains, no error is raised, and it quietly learns from corrupted or shifted data. The test failure is silent; the impact is delayed by days or weeks.
Observability: The failure mode without lineage is debugging by archaeology. A model degraded three months ago. The data pipeline has been updated twice since. Which data snapshot produced the current model? If lineage was not tracked, this question may not have an answer.
Think about it: A team describes their current ML system as follows:
"We have a training script that runs every Sunday at 2am via a cron job. It always produces a model. We keep the last three models in an S3 bucket named by date. Deployment is done by the senior ML engineer, who SSHs into the serving server and replaces the model file. We check model quality by watching the product dashboard — if click-through rate drops, we investigate. The training data comes from a database query that we've been using for two years."
Score this team on all five principles (0 = not present, 1 = partial, 2 = fully present). Identify the single highest-risk gap and explain what production failure it is most likely to cause.
Expert thinking
Scoring:
| Principle | Score | Evidence |
|---|---|---|
| Automation | 1/2 | Training is automated (cron), but deployment is manual (SSH + file replacement) |
| Reproducibility | 0/2 | Models stored by date in S3, but no versioning of data snapshot, feature code, params, or environment |
| CI/CD/CT/CM | 0/2 | CT exists only as a schedule (no trigger logic); no CI; no CD; no CM |
| Comprehensive testing | 0/2 | No mention of data tests, training tests, model quality gates, or deployment tests |
| Observability | 0/2 | Business dashboard only — no lineage, no feature monitoring, no prediction monitoring |
Total: 1/10
Highest-risk gap: Reproducibility (score 0)
The most dangerous near-term failure scenario: the senior ML engineer deploys a model on a Tuesday. On Thursday, click-through rate drops. The engineer tries to roll back. The previous model is in S3 under last Sunday's date. But the deployment wasn't from last Sunday's model — it was a model that was trained on modified data the engineer pulled manually for a one-off experiment and never documented. There is no record of which data produced the deployed model. Rolling back is impossible without knowing which artifact to restore, and the artifact may not be in S3 at all.
This is a real failure pattern. It produces a multi-day incident, a manual audit of every model produced in the past month, and eventually a decision to redeploy the last known-good model — which was trained weeks ago and is now stale.
The single fix: before anything else, establish artifact versioning: every model stored in S3 must have an associated metadata file recording the exact training script commit hash, the database query used, the date range of training data, and the environment (pip freeze). This costs one engineer-day to implement and prevents the described failure permanently.
Second highest risk: No data tests (Comprehensive testing score 0)
The database query has been running for two years. This means the team has been assuming the data schema, data quality, and data distribution have been stable for two years — without checking. In practice, upstream systems evolve. A column gets nulled out for certain user segments. A join key changes behavior for a new market. The training script runs without errors; it just trains on subtly wrong data. The model degrades slowly, and the business dashboard shows a slow decline that nobody attributes to the training data change because nobody knew anything changed.
Self-assessment checklist:
- Did you score each principle separately rather than averaging a single impression?
- Did you identify reproducibility as the highest-risk gap (score 0, and the failure mode is immediate and unrecoverable)?
- Did you connect the specific failure mode (rollback impossible) to the missing capability (data + artifact versioning)?
- Did you identify the database query as a hidden risk even though it "hasn't changed"?
Choosing Your Stack: The Capability Map

The most common tooling mistake is buying the answer before understanding the question. A team with two models in production does not have an orchestration problem — they have a notebook problem. A team with one engineer running manual deployments does not need Kubernetes — they need a deployment script with a rollback mechanism.
The capability map sequences investments by the production pain they solve, not by what's fashionable:
- Experiment tracking — before you have a model registry, you need to know which experiment produced the best model
- Data quality checks — before you have a feature store, you need to know if the data the store serves is valid
- Model registry — before you automate deployments, you need a promotion-gated source of truth for what gets deployed
- Orchestration — before you build a training platform, you need reliable pipeline execution
- Feature management — before you invest in a feature store, you need versioned, tested feature code
- Serving platform — before you invest in serving infrastructure, you need a model worth serving reliably
- Production monitoring — before you invest in continuous training, you need signals that tell you when to retrain
Each investment is most valuable when the previous one is stable. Skipping the sequence means building expensive capabilities on a shaky foundation.
MLOps Maturity: Start Where You Are

The maturity ladder is a diagnostic tool, not a target. The question is not "how do we reach Level 2?" — it is "are we at the level appropriate for our current scale, and is the pain of our current level costing us enough to justify moving up?"
| Level | Appropriate when | Moves up when |
|---|---|---|
| 0 — Manual | ≤2 models, internal use, low stakes | Manual ops take > 1 day/week per model |
| 1 — Pipeline automation | 1–5 models, production traffic, growing team | Model promotions and retraining create coordination overhead |
| 2 — Full CI/CD | 5+ models, multiple teams, real SLOs | Level 1 still requires significant manual gates |
Think about it: A team has the following profile:
- 4 models in production: a search ranking model, a fraud detection model, a price optimization model, and a customer churn predictor
- 6 data scientists, 2 ML engineers, 1 platform engineer
- Each model retrains weekly on a cron job; results checked manually before deployment
- Model promotion requires a Slack message to the platform engineer, who manually updates the serving config
- Incident last quarter: the fraud model was silently serving outdated predictions for 9 days after a data pipeline issue corrupted the retraining job — nobody noticed until fraud rates increased
What maturity level is this team at? What single operational change would most directly prevent the incident from recurring? What would need to be true before investing in full Level 2 CI/CD automation?
Expert thinking
Current maturity level: 1 (weak)
The team has the structural hallmarks of Level 1 — orchestrated training (cron-based), some validation (manual check before deployment), and a model registry of sorts (serving config). But the 9-day silent failure reveals Level 1 gaps: no CM (Continuous Monitoring) to detect that the fraud model was stale, no automated quality gate that would have blocked the corrupted retraining job's output from being promoted, and no alerting on prediction distribution shift.
They are Level 1 in pipeline automation but have not yet implemented the monitoring and quality gate discipline that makes Level 1 safe.
The single highest-impact operational change:
An automated quality gate on model promotion, triggered on every retraining job completion. The gate checks:
- Did the model train to completion (no job failure)?
- Does the model's offline metric (precision, AUC, etc.) meet a floor threshold relative to the current production model?
- Does the model's prediction distribution on a held-out validation set match expectations (within statistical tolerances)?
If any gate fails, the new model is NOT promoted. An alert fires to the ML engineer. The current production model continues serving.
This single change would have caught the corrupted retraining job — a job that produces a model with degraded offline metrics or a shifted prediction distribution would have been blocked at the gate, not silently promoted.
What must be true before Level 2 CI/CD:
Level 2 automation (automated testing + automated deployment + automated rollback) is justified when:
- Level 1 gates are stable and trusted. If the team does not yet trust the automated quality gate to reliably block bad models, automating the promotion decision adds risk, not reliability. Earn trust through 4–6 weeks of running the gate in "advisory mode" — flag but don't block — and verify it catches real issues without false positives.
- Model promotion frequency is high enough to justify automation. With 4 models retraining weekly, that is ~16 promotion events per week. If each requires a platform engineer Slack message and manual config update, that is a material coordination cost. At this scale, Level 2 automation is cost-justified.
- Rollback is tested and fast. Before automating promotions, the team must verify that rollback works. Automated promotion without tested rollback is worse than manual promotion — you can deploy faster but cannot recover faster.
Self-assessment checklist:
- Did you identify the team as Level 1 (not Level 0), noting the presence of orchestration and some validation?
- Did you identify the specific gap: monitoring and automated quality gates, not pipeline automation itself?
- Did your single change address the root cause of the incident (no quality gate), not a symptom?
- Did you specify concrete conditions for Level 2, not just "when they're ready"?
Villain Case Study: The Kubeflow Trap
A mid-size product team has three models in production, all deployed manually by one senior ML engineer who reruns notebooks by hand. The team reads about Uber Michelangelo and wants the same. They choose Kubeflow — the open-source Kubernetes-native ML platform used at major tech companies.
Six months later: none of the original models have been retrained on the new platform. Two months were spent on installation — Kubernetes cluster provisioning, Istio service mesh, certificate management, and debugging YAML configuration. Data scientists need Kubernetes expertise to submit a training job. The ML engineer who understood the setup left. No new models have shipped.
The four structural failures:
1. Maturity mismatch: Kubeflow is designed for Level 2–3 organizations: ten or more models in production, a dedicated platform engineering team, teams large enough to amortize the operational complexity. A team with three models is not that. The tool is not wrong; the application is wrong. As documented across the engineering community: "For a team of three data scientists, Kubeflow requires a full-time platform engineering role just to keep running." [ZenML Blog, 2023; "Do Not Use Kubeflow!" — Josue Luzardo Gebrim, 2023]
2. Expertise acquisition cost was not budgeted. Kubeflow requires Kubernetes operations depth — service mesh management, certificate rotation, YAML configuration debugging — that is not part of the ML engineer skill set. The team did not budget for training or hiring this expertise before beginning the adoption. The expertise gap caused every problem to take three times as long to resolve.
3. Platform became the product. The team's engineering capacity — which should have been spent improving models — was entirely consumed by keeping the platform alive. This is the inverse of the intended outcome. The platform exists to enable ML work; when the platform team spends all its time on the platform, the ML work stops.
4. No incremental value delivery. Level-appropriate platforms (Prefect Cloud, managed model registries, managed serving endpoints) could have solved 80% of the operational pain in two weeks, with models continuing to ship throughout. The team's choice of all-or-nothing platform adoption meant zero value delivered in six months.
The lesson: The correct question is not "what would a large tech company use?" It is "what is the cheapest reliable solution for the production pain I have today?" Platform sophistication should be earned by production scale, not adopted in anticipation of it.
Sources: "Do Not Use Kubeflow!" — Josue Luzardo Gebrim, Medium (2023); ZenML Blog, "8 Alternatives to Kubeflow" (2023); engineering community practitioner assessments (mlai.qa, r/mlops, 2019–2023).
Hero Case Study: Netflix Metaflow — Platform Absorbs Complexity
By 2018, Netflix had hundreds of ML projects spanning recommendation, content demand forecasting, and media processing. The path from a working notebook to production took a median of four months. An internal audit found that 60% of ML code was infrastructure boilerplate. Only 40% was data science work.
Netflix built Metaflow internally. In 2019 they open-sourced it.
The foundational design decision: complexity surfaces to the platform team, not the users. Kubernetes, compute scheduling, hardware selection, and fault tolerance are the platform engineering team's concerns. Data scientists write Python. The same code runs locally and in production — zero changes.
The four decisions that explain the result:
Decision 1 — No DSL. Every workflow is plain Python. Any Python developer can read and debug a Metaflow flow without platform training. Onboarding time dropped to near zero.
Decision 2 — Multiple on-ramps. Netflix did not mandate one canonical path. The platform accommodates different project types rather than forcing all workflows through one pipeline shape.
Decision 3 — Last-mile deployment solved in the platform. Metaflow Hosting enables one-click promotion from a tested workflow to a production-grade microservice endpoint. The gap between "working pipeline" and "deployed endpoint" was closed as a platform feature, not left to each team.
Decision 4 — Platform team owns Kubernetes. Data scientists never interact with container orchestration. This is the operational implementation of the design principle.
The result: Median time from project start to production — four months to seven days. By 2024, hundreds of Metaflow workflows in production across recommendation, streaming quality, content demand, and generative AI. [Netflix Tech Blog, 2024; InfoQ, March 2024]
The direct contrast with the Kubeflow trap: Netflix's platform absorbed complexity. The Kubeflow trap pushed complexity onto data scientists. Both involve Kubernetes. The outcomes are opposite because the design principle is opposite.
Sources: "Supporting Diverse ML Systems at Netflix" — Netflix Tech Blog (2024); InfoQ: "Netflix Uses Metaflow to Manage Hundreds of AI/ML Applications at Scale" (March 2024).
What's next: Advanced Practice
The free section above introduced the three-moving-parts diagnostic framework, the five operating principles, the maturity ladder, and the operational strategy checklist — and tested them against realistic scenarios.
The advanced section goes further: designing full MLOps operational strategies under constraints, diagnosing production incidents using the framework, and building and evaluating monitoring systems. The Python implementations show how to build a reproducibility tracker and a drift detector from scratch.
Advanced Exercise preview: You are handed a production incident report: a recommendation model's offline AUC improved by 3% after last week's retraining, but online click-through rate dropped 7%. The team declares the retraining a success and rolls back to the previous model. You are asked whether this was the right decision and what they missed...
Production Challenge preview: A team's CT (Continuous Training) loop has been running for three months. Last week, it retrained successfully, promoted the new model, and online metrics immediately degraded. The team disabled the CT loop. How do you redesign it so this can't happen again?
Subscribe to unlock the full advanced practice section.
Advanced Exercise 1: Designing the Operational Strategy for a New ML System
The scenario:
A fintech company is building a credit risk scoring model. The model will power loan approval decisions for consumer loans up to $50,000. Here is the system context:
- Data: 18 months of historical loan applications and outcomes (approved/denied + repayment history). Refreshed weekly from the core banking system.
- Team: 3 data scientists, 1 ML engineer, shared access to a DevOps team.
- SLO: Serving latency < 200ms (p99). System availability > 99.9%.
- Compliance: Subject to ECOA (Equal Credit Opportunity Act) and FCRA. Must provide adverse action reasons for denied applications. Model decisions must be auditable.
- Current state: A logistic regression model, retrained quarterly by a data scientist running a notebook. Deployed by the ML engineer copying a pickle file to the serving server.
Your task:
Part A — The eight operational strategy decisions (30 points)
Walk through each of the eight decisions in the operational strategy checklist. For each, give your specific answer for this system and justify it in one or two sentences.
- Release unit: model artifact only, or pipeline + model?
- CT triggers: schedule, data event, or quality threshold?
- Quality gates: what specific checks must pass before promotion?
- Promotion policy: manual or automated?
- Serving mode: online, batch, or streaming?
- Ownership: on-call assignment and rollback authority?
- Monitoring scope: what four signals?
- Governance: what audit and compliance artifacts are required?
Part B — The highest-risk gap (15 points)
Identify the single highest-risk gap in the current system. Describe what specific production failure it is most likely to cause, with a concrete failure scenario. Describe the minimum viable fix.
Part C — Maturity level and transition plan (15 points)
What maturity level is the current system at? What is the target maturity level given the compliance and SLO requirements? Design a 90-day transition plan with three milestones.
Expert thinking
Part A — The eight decisions:
1. Release unit: Pipeline + model (not model artifact alone)
Justification: Credit risk models depend on specific feature engineering logic — the preprocessing code that transforms raw application data into model inputs is part of the release. Deploying a new model with old feature code, or new feature code with an old model, creates silent serving behavior. The pipeline and model must be versioned and deployed together. Every model artifact in the registry must reference the exact pipeline code commit that produced it.
2. CT triggers: Quality threshold + data volume (not pure schedule)
Justification: Quarterly retraining is far too infrequent for a credit risk model — consumer credit behavior can shift meaningfully within 90 days due to macroeconomic conditions. But retraining on a fixed schedule without a quality gate is also insufficient. Recommended: trigger retraining when (a) the model's PSI (Population Stability Index) on incoming application features exceeds 0.1 (indicating distribution shift), OR (b) 8 weeks have elapsed since the last retraining, whichever comes first. This ensures the model stays current without retraining unnecessarily.
3. Quality gates: Three specific checks
- Metric floor: The new model's AUC on the held-out validation set must be ≥ 0.005 higher than the current production model (improvement, not just parity). If the new model is worse, do not promote.
- Fairness check: The new model must pass ECOA-required fairness checks — specifically, the model's approval rate across protected class proxies (age, geographic region as a race proxy) must not deviate by more than 5% from the baseline. This is a compliance gate, not a performance gate.
- Adverse action coverage check: The model's explanations (adverse action reasons) must be generatable for > 99.5% of denial decisions. A model that cannot produce required regulatory explanations for a material fraction of decisions fails this gate.
4. Promotion policy: Manual approval with automated gate pre-check
Justification: Given the compliance requirements and the financial impact of credit decisions, automated promotion without human review is not appropriate for the initial deployment. The automated gates (metric floor, fairness check, adverse action check) run first. If all pass, the promotion request is surfaced to a human approver with a dashboard showing the gate results, the performance delta, and a sample of the model's decisions on a representative test set. The human approver has one business day to approve or deny.
This is not fully automated, but it is not purely manual either — the human is reviewing a structured, pre-validated candidate rather than doing the analysis themselves.
5. Serving mode: Online (synchronous)
Justification: The < 200ms p99 latency requirement and the nature of the use case (real-time loan application decisions) require online serving. Batch serving would create an unacceptable user experience. The serving infrastructure must be designed to handle the p99 latency requirement with the model loaded in memory, not loaded on-demand.
6. Ownership: ML engineer on-call; VP of Risk as business escalation; ML engineer has rollback authority
Justification: The ML engineer who operates the model is the appropriate on-call owner for technical failures. For compliance-related issues (fairness violations, inability to produce adverse action reasons), escalation to the VP of Risk and Legal is required. Rollback authority should sit with the ML engineer for technical issues (no approval required for rollback — rollback must be fast). For planned model replacements, approval is required. Rollback is treated as an emergency operation.
7. Monitoring scope (four signals):
- System: p99 latency, request error rate, serving availability
- Data: PSI on all input features weekly; alert if PSI > 0.1 on any feature used by the model
- Model: Approval rate trend weekly; prediction score distribution shift; proxy performance metrics (30-day early repayment rate as a leading indicator of model quality, since full repayment labels take 12–24 months to materialize)
- Compliance: Weekly adverse action reason coverage check; monthly fairness audit across protected class proxies; model decision audit log completeness check
8. Governance artifacts:
- Model card: Required for each promoted model. Contents: training data description, feature list, evaluation metrics by demographic slice, adverse action reason methodology, known limitations.
- Audit log: Every model decision (approved/denied + model version + feature values at decision time) must be stored for 7 years per FCRA requirements.
- Lineage record: Every promoted model must have a registered lineage record: training script commit, data snapshot date range, preprocessing pipeline version, training run ID, gate results.
- Adverse action letter template: The model must be integrated with the adverse action letter generation system. The top contributing negative features must be translatable into the ECOA-required "principal reasons for adverse action."
Part B — Highest-risk gap: No audit log and no model lineage
The current system stores a pickle file on a serving server. There is no record of: which training data produced it, when it was deployed, what its predictions were, or which model version made each decision.
The failure scenario: A denied applicant files a regulatory complaint citing ECOA. The regulator requests all model decisions made for applicants with similar profiles over the past 18 months, along with the model versions that made those decisions and the feature values at decision time.
The current system cannot produce this. The pickle file does not record when it was deployed. The notebook run that produced it is not tracked. The individual prediction logs do not exist.
The regulatory penalty for failing to produce adverse action audit records can reach $10,000 per violation under FCRA. At loan application volumes of thousands per month, this is a material compliance risk.
Minimum viable fix: Before the next model deployment, add two components:
- Prediction logging: Every scoring call logs: timestamp, application ID, model version ID, feature values, model output (score and decision), adverse action reasons if denied. Stored in an append-only data store with 7-year retention.
- Model lineage tagging: The model serving endpoint tags every prediction with the model version ID. The model registry maps each version ID to its training metadata.
This can be implemented in 2–3 engineer-days and transforms a material compliance risk into a resolved operational requirement.
Part C — Maturity level and transition plan:
Current level: 0 (Manual)
Evidence: notebook-driven retraining, manual deployment by file copy, no quality gates, no monitoring, quarterly cadence.
Target level: 1.5 (Pipeline automation with compliance controls)
Full Level 2 CI/CD is not yet justified — the team is small, the model count is low, and the compliance requirements need to be stabilized before automation adds velocity. The target is a robust Level 1 with compliance-specific additions (audit logging, fairness gates, lineage tracking).
90-day transition plan:
Milestone 1 (Days 1–30): Foundation — reproducibility and compliance
- Implement prediction logging and model lineage tagging (compliance minimum viable)
- Convert the notebook to a parametric training script with a documented entrypoint
- Implement the model registry: every trained model stored with training metadata
- Add the three quality gates (metric floor, fairness check, adverse action coverage)
Milestone 2 (Days 31–60): Automation — pipeline and promotion
- Build the training pipeline as an orchestrated job (Prefect, Airflow, or cloud-managed equivalent)
- Implement automated quality gate execution on every training run
- Implement the human approval workflow: gate results surfaced in a dashboard, one-day approval window
- Implement rollback: the ML engineer can revert to the previous registered model in < 10 minutes
Milestone 3 (Days 61–90): Monitoring — detect before business impact
- Implement feature distribution monitoring with PSI alerts
- Implement the four monitoring signals (system, data, model, compliance)
- Define and document retraining triggers based on PSI thresholds
- Conduct a first monitoring review to baseline the alert thresholds
Self-assessment checklist:
- Did you specify a compliance-specific quality gate (not just a performance metric gate)?
- Did you choose manual promotion with automated pre-checks rather than fully automated or fully manual?
- Did your highest-risk gap answer identify the audit log absence as a regulatory exposure, not just a technical gap?
- Did your transition plan sequence compliance fixes before automation (not the other way around)?
Advanced Exercise 2: Postmortem — The Model That Improved and Made Things Worse
The scenario:
A recommendation system at an e-commerce company. The system surfaces product recommendations on the homepage. Metric: 7-day revenue per user (RPU7) measured via A/B test.
Last month's timeline:
- Week 1: Data team updates the feature pipeline. A previously unused feature — "days since last purchase" — is added to the feature set. The model is retrained on the updated pipeline.
- Week 2: The new model is evaluated offline. AUC improves from 0.81 to 0.85 (+0.04). The team is excited. The model is promoted to production.
- Week 3: The A/B test shows the new model's group has +6% CTR vs control. The team declares success and begins ramping the new model to 100% traffic.
- Week 4: RPU7 results arrive. The new model's group shows –4% RPU7 vs control. The team is confused — CTR is up but revenue is down.
Your task:
Part A — Root cause diagnosis (20 points)
Identify the most likely root cause of the CTR/RPU7 divergence. Walk through each of the three moving parts (code, data, model) and assess whether each contributed to the problem.
Part B — The specific framing failure (15 points)
This postmortem reveals a problem that predates the model update. What is the upstream framing failure that made this outcome predictable? (Hint: it is in Chapter 1.1 material but the MLOps framework surfaces it operationally.)
Part C — Operational changes (15 points)
What changes to the MLOps operational strategy would have caught this before the ramp? Be specific about which stage in the lifecycle, which monitoring signal, and what the gate or alert would have looked like.
Expert thinking
Part A — Root cause diagnosis:
Code (pipeline change): The addition of "days since last purchase" is the most likely proximate cause. This feature — time since last purchase — creates a strong signal for user engagement recency. A model with this feature learns to recommend products to users who purchased recently (high recency = high engagement probability). The problem: recently purchasing users have lower incremental revenue potential. The model learned to optimize for users who were already going to buy, rather than converting users who were not. This is a proxy alignment failure operationalized through a feature addition.
Data: The feature change itself is the data-side contribution. The feature is informative — it improves the model's ability to predict whether a click will occur. The model is now better at predicting clicks. It is worse at predicting revenue-generating behavior, because click propensity and purchase propensity are correlated but not equivalent.
Model: The model improved at the proxy task (predicting clicks) and degraded at the business task (predicting revenue-generating purchases). This is expected — the model optimizes for what it is trained on. The AUC improvement of +0.04 reflects better click prediction, not better revenue prediction. The model did exactly what it was designed to do.
Root cause summary: The code change (feature addition) shifted the model's learned representation toward click-optimized behavior. The model now correctly ranks users by click likelihood. Users with high click likelihood in the "days since last purchase" dimension are recent purchasers who are browsing, not converting. CTR goes up because engagement goes up. RPU7 goes down because the system is now optimizing for browser engagement, not purchase conversion.
Part B — The upstream framing failure:
The recommendation system is using click-through rate as its model metric and proxy label. Chapter 1.1's proxy label rubric identifies click as a classic high-gaming-risk proxy for purchase intent: "Many carts never convert." The addition of a recency feature amplified this misalignment.
The upstream framing failure is that the product outcome was not clearly specified. "Recommend products" is not a product outcome — "increase purchase conversion among browsing users" is. If the product outcome had been specified as purchase-intent-driven, the proxy label would have been "add-to-cart + purchase within 7 days," not "click."
The feature addition made a misaligned proxy more powerful. Fixing the feature pipeline is not the root cause fix — aligning the proxy label to the business outcome is.
Part C — Operational changes that would have caught this:
Stage 4 (Validate and Register) — Multi-metric quality gate:
The quality gate checks AUC improvement. A multi-metric gate would have also checked the model's RPU-correlated metric: "predicted purchase probability" or "predicted add-to-cart rate" on a held-out set with known purchase outcomes. If CTR-AUC improves while purchase-AUC stays flat or declines, the gate should surface this divergence as a warning.
Specific gate: "New model must show AUC improvement on purchase label (add-to-cart + 7-day purchase), not only on click label. If click-AUC improves and purchase-AUC does not, flag for human review before promotion."
Stage 5 (Deploy) — A/B test design includes RPU as a primary metric:
The A/B test measured CTR in Week 3. RPU7 data arrived in Week 4 — after the ramp had begun. The A/B test should have been designed with RPU7 as the primary success metric and CTR as a secondary (guardrail) metric. Ramp decisions should be gated on the primary metric, not the secondary.
Specific operational change: "Model promotions for the recommendation system require A/B test results on RPU7 (7-day revenue per user) before any ramp above 10% traffic. CTR is a guardrail, not a decision metric."
Stage 7 (Monitor) — Business KPI proxy monitoring during ramp:
If the A/B test must run for multiple weeks before RPU7 results arrive, add a leading indicator: "add-to-cart rate per user" as an intermediate signal. Add-to-cart is available in hours; it is more aligned with purchase than raw CTR. A decline in add-to-cart rate during the ramp would have been an early warning before RPU7 results confirmed the problem.
Self-assessment checklist:
- Did you identify "days since last purchase" specifically as the feature contributing to the CTR/RPU divergence?
- Did you connect the root cause to proxy label misalignment (Chapter 1.1 framing failure), not just the feature change?
- Did your operational changes address Stage 4 (multi-metric quality gate), not just Stage 5 (better A/B test design)?
- Did you propose a leading indicator for the monitoring gap, not just "wait for RPU7"?
Advanced Exercise 3: Designing the CI/CD/CT/CM Loops for a New Production System
The scenario:
A healthcare tech company is building a patient readmission risk model. The model predicts whether a patient discharged from hospital will be readmitted within 30 days. Predictions are used by care coordinators to prioritize outreach calls.
System characteristics:
- Input: patient discharge records from the EHR system (Epic)
- Output: risk score (0–1) + top 3 contributing risk factors for each patient
- Volume: ~500 predictions per day, within 4 hours of discharge
- Training data: 3 years of historical discharge records and 30-day outcomes
- Label availability: readmission labels available 30 days after discharge
- Compliance: HIPAA; model outputs may not include race or ethnicity directly; must be auditable
Your task:
Part A — CI (Continuous Integration) gates (15 points)
Design the CI pipeline for this system. For each gate in the CI pipeline, specify:
- What it checks
- When it runs (on PR, on merge, both)
- Whether it is deterministic or LLM/statistical
- What constitutes a pass vs fail
Part B — CT (Continuous Training) trigger strategy (20 points)
Design the CT trigger strategy. Address:
- What triggers should cause a retraining (justify each)
- What should NOT trigger a retraining (and why)
- How you handle the 30-day label lag in the retraining cycle
- What the quality gate looks like before a retrained model can be promoted
Part C — CM (Continuous Monitoring) dashboard (15 points)
Design the monitoring dashboard for the care coordination team and the ML team. For each audience, specify: the 3–5 most important signals to display, the alert thresholds, and who gets notified when each alert fires.
Expert thinking
Part A — CI pipeline gates:
Gate 1: Code linting and type checking (on PR)
- What it checks: Python type annotations, import hygiene, code style (black/flake8), no hardcoded PHI (patient health information) in code
- Deterministic: yes
- Pass/fail: any linting error or PHI pattern match = fail
Gate 2: Unit tests for feature transformations (on PR)
- What it checks: Each feature computation function is unit tested against synthetic patient records. Tests verify: correct handling of null values (common in EHR data), correct date arithmetic for "days since last admission," correct encoding of categorical fields
- Deterministic: yes
- Pass/fail: < 100% test pass rate = fail. EHR-derived features have many edge cases; unit tests must be comprehensive
Gate 3: Schema validation on training data pipeline (on merge to main)
- What it checks: The training data pipeline output matches the expected feature schema — correct column names, data types, null rates within expected bounds (e.g., "age" null rate < 1%), and value ranges within clinically plausible bounds (e.g., heart rate between 20 and 300)
- Deterministic: yes (schema + statistical bounds checks)
- Pass/fail: any schema mismatch or out-of-bounds rate exceeds threshold = fail
Gate 4: Training sanity check (on merge to main, full pipeline run)
- What it checks: The model trains to completion; the final validation AUC is above a floor of 0.70 (minimum acceptable for clinical use); the top 3 risk factors produced for 100% of patients (coverage check); no PHI leaks into model artifact or prediction outputs
- Mix of deterministic and statistical
- Pass/fail: AUC < 0.70 = fail; top factor coverage < 99.5% = fail; PHI pattern detected in outputs = fail (automated blocker)
Gate 5: HIPAA compliance check (on merge, before any deployment)
- What it checks: Model does not directly use race/ethnicity features; prediction logging strips PHI before storage; audit log encryption verified; data retention policy enforced (7-year minimum)
- Deterministic: yes
- Pass/fail: Any HIPAA compliance check failure = hard fail, requires human review before proceeding
Part B — CT trigger strategy:
Trigger 1: Label batch arrival (every 30 days)
Every 30 days, a new batch of 30-day outcome labels becomes available. This is the primary trigger. When a new label batch arrives:
- Compute rolling AUC on the most recent 30 days of predictions (now labeled)
- If rolling AUC < current production model's validation AUC − 0.02 (meaningful degradation): trigger retraining
- If rolling AUC is within tolerance: log the metric, do not retrain
This is the "performance-based trigger" — it retains the model when it's still performing and retrains when measurable degradation appears. The 30-day label lag means this trigger fires approximately monthly.
Trigger 2: Feature distribution shift (weekly monitoring)
Weekly, run PSI on all input features for the past week's patients vs. the training data distribution. If any feature's PSI > 0.1 (moderate shift) or any feature's PSI > 0.2 (significant shift):
- PSI > 0.1: flag for review, no automatic retraining
- PSI > 0.2: trigger an early retraining review (the distribution has shifted meaningfully; wait for the next label batch to arrive before committing to retraining, but front-load the data collection)
Justification: Patient population characteristics can shift due to seasonal illness patterns, referral source changes, or hospital policy changes. Distribution shift is an early warning signal, not an automatic trigger — because the model may still perform well despite distribution shift if the relationship between features and outcome is stable.
Trigger 3: Volume anomaly
If daily prediction volume drops below 100 (50% of normal) for 3 consecutive days, alert the ML engineer. This may indicate an EHR data pipeline failure, not a model quality issue — but it produces stale predictions and must be investigated.
What should NOT trigger retraining:
- Calendar schedule alone: Monthly retraining on a fixed calendar date is wasteful if the model is performing well and the distribution is stable. Resource-constrained teams should retrain on evidence, not schedule.
- A single outlier day: A single day with unusual PSI should not trigger retraining — it may be a data ingestion artifact. Require 3 consecutive days of elevated PSI before escalating.
- Pressure from stakeholders: "The care coordinators feel like the model isn't as good" is not a retraining trigger. It is a signal to pull monitoring data and investigate. If monitoring shows no degradation, the model is not the problem.
Handling the 30-day label lag:
The label lag means the model is always training on data that is 30 days old. This is unavoidable given the outcome definition. Mitigations:
-
Use early indicators as proxy features: "emergency department visit within 7 days" is available in 7 days; "readmission for any cause within 7 days" is available in 7 days. These can be added as additional monitoring signals even if they are not the primary label.
-
The validation set for quality gates uses held-out labeled data (patients from 31–60 days ago, now fully labeled). The gate confirms the retrained model performs on data similar to the recent production population.
-
Accept the lag explicitly: document that the CT system responds to degradation with a 30-day minimum lag from onset to detection to retraining. Design the quality gate to ensure this lag does not allow a significantly degraded model to remain in production undetected.
Quality gate before promotion:
- AUC on held-out labeled validation set ≥ 0.75 (clinical efficacy minimum)
- AUC ≥ current production model AUC − 0.01 (no meaningful regression allowed)
- Top-3 factor coverage ≥ 99.5% (care coordinators must receive reasons)
- Fairness check: approval rates (high-risk classification) across age deciles and proxy indicators must not deviate > 10% (HIPAA-compliant equity check)
- Adverse event rate on the 30-day labeled set: readmission prediction sensitivity ≥ 0.70 for high-risk patients (clinical safety gate)
Part C — Monitoring dashboards:
ML Team Dashboard (technical):
| Signal | Alert Threshold | Notification |
|---|---|---|
| Daily prediction volume | < 200 for 2 consecutive days | Slack: ML engineer + data engineer |
| Feature PSI (weekly) | Any feature PSI > 0.1 | Slack: ML engineer |
| Rolling 30-day AUC (on label arrival) | < 0.73 (−0.02 from baseline) | PagerDuty: ML engineer |
| Prediction latency p99 | > 2 hours post-discharge (vs. 4-hour SLO) | Slack: ML engineer |
| Top-3 factor coverage | < 99% for any 7-day period | Slack: ML engineer |
Care Coordination Team Dashboard (clinical/operational):
| Signal | What it shows | Alert Threshold | Notification |
|---|---|---|---|
| High-risk patient count (daily) | Number of patients flagged as high-risk for outreach | Change > 30% day-over-day | Email: care coordination manager |
| Model availability status | Is the risk scoring system operational? | Any downtime | Slack: care coordination manager |
| Outreach coverage rate | What % of high-risk patients received outreach within 24h | < 80% | Email: care coordination manager |
| 7-day readmission rate (lagged) | Actual readmissions vs model's predicted high-risk patients | Statistical anomaly vs 30-day baseline | Monthly report: clinical quality team |
The care coordination dashboard does not show AUC or PSI — those metrics require ML expertise to interpret. It shows operationally actionable signals: is the system working, how many patients need outreach, and is the outreach completing on time.
Self-assessment checklist:
- Did your CI gates include a HIPAA compliance check as a hard blocker?
- Did your CT trigger strategy use performance-based triggers (not calendar alone) and explicitly address the 30-day label lag?
- Did your quality gate for promotion include a clinical safety gate (sensitivity on high-risk patients), not just AUC?
- Did you design separate dashboards for ML team vs care coordination team, with audience-appropriate signals for each?
Python Implementation 1: MLOps Reproducibility Tracker
The single most important short-term MLOps investment for most teams is reproducibility: ensuring every trained model can be reconstructed from documented, versioned inputs. This implementation shows how to build a lightweight reproducibility tracker that versions the six components together: code, data, features, params, environment, and artifact.
import hashlib
import json
import os
import subprocess
import platform
from datetime import datetime
from dataclasses import dataclass, field, asdict
from pathlib import Path
from typing import Any, Dict, Optional
import pickle


@dataclass
class ModelLineage:
    """Complete provenance record for one trained model artifact."""
    run_id: str
    timestamp: str

    # The six versioned components
    code_commit: str           # git commit hash
    data_snapshot_hash: str    # hash of training data
    data_description: str      # human-readable: date range, row count, filters
    feature_version: str       # version tag of feature transform code
    params: Dict[str, Any]     # hyperparameters used
    environment: Dict[str, str]  # python version, key package versions
    artifact_path: str         # path to saved model artifact
    artifact_hash: str         # SHA256 of the artifact file

    # Quality gate results
    validation_metrics: Dict[str, float] = field(default_factory=dict)
    gate_results: Dict[str, bool] = field(default_factory=dict)
    promoted: bool = False
    promoted_at: Optional[str] = None
    notes: str = ""


class ReproducibilityTracker:
    """
    Lightweight MLOps reproducibility tracker.
    Versions the six components required to reconstruct any trained model.
    """

    def __init__(self, registry_path: str = "./model_registry"):
        self.registry_path = Path(registry_path)
        self.registry_path.mkdir(parents=True, exist_ok=True)
        self.registry_file = self.registry_path / "registry.json"
        self._load_registry()

    def _load_registry(self):
        if self.registry_file.exists():
            with open(self.registry_file) as f:
                self.registry = json.load(f)
        else:
            self.registry = {"models": {}}

    def _save_registry(self):
        with open(self.registry_file, "w") as f:
            json.dump(self.registry, f, indent=2)

    # --- Component 1: Code version ---

    def get_code_version(self) -> str:
        """Get the current git commit hash."""
        try:
            result = subprocess.run(
                ["git", "rev-parse", "HEAD"],
                capture_output=True, text=True, check=True
            )
            commit = result.stdout.strip()
            # Check for uncommitted changes
            dirty = subprocess.run(
                ["git", "status", "--porcelain"],
                capture_output=True, text=True
            )
            if dirty.stdout.strip():
                print(f"WARNING: Uncommitted changes detected. Commit hash: {commit[:8]}-dirty")
                return f"{commit}-dirty"
            return commit
        except (subprocess.CalledProcessError, FileNotFoundError):
            return "git-unavailable"

    # --- Component 2: Data version ---

    def hash_dataset(self, data) -> str:
        """Create a stable hash of a pandas DataFrame or numpy array."""
        try:
            import pandas as pd
            import numpy as np
            if isinstance(data, pd.DataFrame):
                # Hash the values, shape, and column names together
                content = (
                    str(data.shape) +
                    str(sorted(data.columns.tolist())) +
                    str(data.values.tobytes()[:10000])  # first 10KB for speed
                )
            elif isinstance(data, np.ndarray):
                content = str(data.shape) + str(data.tobytes()[:10000])
            else:
                content = str(data)
            return hashlib.sha256(content.encode()).hexdigest()[:16]
        except ImportError:
            return hashlib.sha256(str(data).encode()).hexdigest()[:16]

    # --- Component 5: Environment version ---

    def capture_environment(self, key_packages: list = None) -> Dict[str, str]:
        """Capture Python version and versions of key ML packages."""
        env = {
            "python": platform.python_version(),
            "platform": platform.platform(),
        }

        default_packages = key_packages or [
            "scikit-learn", "xgboost", "lightgbm",
            "pandas", "numpy", "scipy"
        ]

        for pkg in default_packages:
            try:
                result = subprocess.run(
                    ["pip", "show", pkg],
                    capture_output=True, text=True
                )
                for line in result.stdout.split("\n"):
                    if line.startswith("Version:"):
                        env[pkg] = line.split(": ")[1].strip()
                        break
            except Exception:
                env[pkg] = "unknown"

        return env

    # --- Component 6: Artifact hash ---

    def hash_artifact(self, artifact_path: str) -> str:
        """SHA256 hash of the saved model artifact."""
        sha256 = hashlib.sha256()
        with open(artifact_path, "rb") as f:
            for chunk in iter(lambda: f.read(4096), b""):
                sha256.update(chunk)
        return sha256.hexdigest()[:16]

    # --- Main: start a run ---

    def start_run(
        self,
        params: Dict[str, Any],
        training_data,
        data_description: str,
        feature_version: str = "unversioned",
        key_packages: list = None
    ) -> str:
        """
        Begin tracking a training run. Returns a run_id.
        Call log_artifact() and log_metrics() after training.
        """
        run_id = datetime.now().strftime("%Y%m%d_%H%M%S")

        self._current_run = {
            "run_id": run_id,
            "timestamp": datetime.now().isoformat(),
            "code_commit": self.get_code_version(),
            "data_snapshot_hash": self.hash_dataset(training_data),
            "data_description": data_description,
            "feature_version": feature_version,
            "params": params,
            "environment": self.capture_environment(key_packages),
            "artifact_path": "",
            "artifact_hash": "",
            "validation_metrics": {},
            "gate_results": {},
            "promoted": False,
            "promoted_at": None,
            "notes": ""
        }

        print(f"[Tracker] Run started: {run_id}")
        print(f"  Code commit: {self._current_run['code_commit'][:12]}")
        print(f"  Data hash: {self._current_run['data_snapshot_hash']}")
        return run_id

    def log_artifact(self, model, run_id: str, artifact_name: str = None):
        """Save model artifact and record its hash in the lineage."""
        if not hasattr(self, '_current_run') or self._current_run["run_id"] != run_id:
            raise ValueError(f"No active run with id {run_id}")

        artifact_name = artifact_name or f"model_{run_id}.pkl"
        artifact_path = str(self.registry_path / artifact_name)

        with open(artifact_path, "wb") as f:
            pickle.dump(model, f)

        self._current_run["artifact_path"] = artifact_path
        self._current_run["artifact_hash"] = self.hash_artifact(artifact_path)
        print(f"  Artifact saved: {artifact_path}")
        print(f"  Artifact hash: {self._current_run['artifact_hash']}")

    def log_metrics(self, metrics: Dict[str, float], run_id: str):
        """Log validation metrics for the run."""
        if not hasattr(self, '_current_run') or self._current_run["run_id"] != run_id:
            raise ValueError(f"No active run with id {run_id}")
        self._current_run["validation_metrics"].update(metrics)

    def run_quality_gates(
        self,
        run_id: str,
        gates: Dict[str, callable]
    ) -> bool:
        """Run quality gates. Gates are {name: callable} returning bool."""
        if not hasattr(self, '_current_run') or self._current_run["run_id"] != run_id:
            raise ValueError(f"No active run with id {run_id}")

        all_pass = True
        metrics = self._current_run["validation_metrics"]

        print(f"\n[Tracker] Running quality gates for {run_id}:")
        for gate_name, gate_fn in gates.items():
            result = gate_fn(metrics)
            self._current_run["gate_results"][gate_name] = result
            status = "PASS" if result else "FAIL"
            print(f"  {gate_name}: {status}")
            if not result:
                all_pass = False

        return all_pass

    def complete_run(self, run_id: str, notes: str = "") -> ModelLineage:
        """Finalize the run record and save to registry."""
        if not hasattr(self, '_current_run') or self._current_run["run_id"] != run_id:
            raise ValueError(f"No active run with id {run_id}")

        self._current_run["notes"] = notes
        lineage = ModelLineage(**self._current_run)
        self.registry["models"][run_id] = asdict(lineage)
        self._save_registry()
        print(f"\n[Tracker] Run {run_id} recorded in registry.")
        return lineage

    def promote(self, run_id: str) -> bool:
        """Mark a model as promoted to production."""
        if run_id not in self.registry["models"]:
            raise ValueError(f"Run {run_id} not found in registry")
        model = self.registry["models"][run_id]
        if not all(model["gate_results"].values()):
            print(f"[Tracker] Cannot promote {run_id}: not all gates passed.")
            return False
        model["promoted"] = True
        model["promoted_at"] = datetime.now().isoformat()
        self._save_registry()
        print(f"[Tracker] Model {run_id} promoted to production.")
        return True

    def get_production_model(self) -> Optional[Dict]:
        """Return the most recently promoted model's lineage."""
        promoted = [
            m for m in self.registry["models"].values()
            if m.get("promoted", False)
        ]
        if not promoted:
            return None
        return max(promoted, key=lambda m: m.get("promoted_at", ""))

    def compare_runs(self, run_id_a: str, run_id_b: str):
        """Print a diff between two runs' lineage records."""
        a = self.registry["models"].get(run_id_a)
        b = self.registry["models"].get(run_id_b)
        if not a or not b:
            print("One or both run IDs not found.")
            return

        print(f"\n[Tracker] Comparing {run_id_a} vs {run_id_b}:")
        for key in ["code_commit", "data_snapshot_hash", "feature_version", "params"]:
            if a.get(key) != b.get(key):
                print(f"  {key}: {str(a.get(key))[:40]} → {str(b.get(key))[:40]}")

        print("  Validation metrics:")
        all_keys = set(a.get("validation_metrics", {}).keys()) | set(b.get("validation_metrics", {}).keys())
        for k in sorted(all_keys):
            va = a.get("validation_metrics", {}).get(k, "—")
            vb = b.get("validation_metrics", {}).get(k, "—")
            delta = f" ({vb - va:+.4f})" if isinstance(va, float) and isinstance(vb, float) else ""
            print(f"    {k}: {va} → {vb}{delta}")


# --- Example usage ---

if __name__ == "__main__":
    from sklearn.ensemble import RandomForestClassifier
    from sklearn.datasets import make_classification
    from sklearn.model_selection import train_test_split
    from sklearn.metrics import roc_auc_score, average_precision_score
    import pandas as pd
    import numpy as np

    # Simulate training data
    X, y = make_classification(n_samples=10000, n_features=20, random_state=42)
    X_df = pd.DataFrame(X, columns=[f"feature_{i}" for i in range(20)])
    X_train, X_val, y_train, y_val = train_test_split(X_df, y, test_size=0.2, random_state=42)

    tracker = ReproducibilityTracker("./example_registry")

    # Define quality gates
    gates = {
        "auc_floor": lambda m: m.get("auc", 0) >= 0.75,
        "pr_auc_floor": lambda m: m.get("pr_auc", 0) >= 0.70,
        "not_worse_than_baseline": lambda m: m.get("auc", 0) >= 0.72,
    }

    # Run 1
    run_id = tracker.start_run(
        params={"n_estimators": 100, "max_depth": 5, "random_state": 42},
        training_data=X_train,
        data_description=f"make_classification synthetic, {len(X_train)} rows, random_state=42",
        feature_version="v1.0.0"
    )

    model = RandomForestClassifier(n_estimators=100, max_depth=5, random_state=42)
    model.fit(X_train, y_train)

    tracker.log_artifact(model, run_id, f"rf_{run_id}.pkl")

    y_pred_proba = model.predict_proba(X_val)[:, 1]
    tracker.log_metrics({
        "auc": roc_auc_score(y_val, y_pred_proba),
        "pr_auc": average_precision_score(y_val, y_pred_proba)
    }, run_id)

    all_passed = tracker.run_quality_gates(run_id, gates)
    lineage = tracker.complete_run(run_id, notes="Baseline RF model")

    if all_passed:
        tracker.promote(run_id)

    # Show production model
    prod = tracker.get_production_model()
    if prod:
        print(f"\nProduction model: {prod['run_id']}")
        print(f"  AUC: {prod['validation_metrics'].get('auc', 'N/A'):.4f}")
        print(f"  Code commit: {prod['code_commit'][:12]}")
        print(f"  Data hash: {prod['data_snapshot_hash']}")
        print(f"  Promoted at: {prod['promoted_at']}")
Python Implementation 2: Data Drift Detector
A monitoring system that catches the most common silent failure mode in ML production: input feature distribution drift. Uses Population Stability Index (PSI) — the industry-standard metric for monitoring credit scoring and ML models — as the primary drift signal.
import numpy as np
import json
from datetime import datetime
from dataclasses import dataclass, field
from typing import Dict, List, Optional, Tuple
from pathlib import Path


@dataclass
class DriftResult:
    feature_name: str
    psi: float
    severity: str        # "stable", "moderate_drift", "significant_drift"
    baseline_dist: List[float]
    current_dist: List[float]
    bin_edges: List[float]
    timestamp: str = field(default_factory=lambda: datetime.now().isoformat())


@dataclass
class MonitoringReport:
    run_timestamp: str
    n_baseline_samples: int
    n_current_samples: int
    feature_results: List[DriftResult]
    overall_status: str   # "healthy", "warning", "critical"
    drifted_features: List[str]
    critical_features: List[str]


class DataDriftDetector:
    """
    Production data drift detector using Population Stability Index (PSI).

    PSI interpretation (industry standard, originally from credit scoring):
    - PSI < 0.1:  Insignificant change — stable, no action needed
    - PSI 0.1–0.2: Moderate shift — investigate and monitor closely
    - PSI > 0.2:  Significant shift — model may be unreliable, review required

    Reference: Siddiqi, N. "Credit Risk Scorecards." Wiley, 2006.
    """

    PSI_STABLE = 0.1
    PSI_WARNING = 0.2

    def __init__(self, n_bins: int = 10, min_bin_size: float = 0.001):
        """
        n_bins: number of bins for distribution comparison.
        min_bin_size: minimum probability to assign to any bin (prevents log(0)).
        """
        self.n_bins = n_bins
        self.min_bin_size = min_bin_size
        self.baseline_stats: Dict[str, Dict] = {}

    def fit_baseline(self, data: Dict[str, np.ndarray]) -> None:
        """
        Fit the detector on baseline (training) data distribution.
        Must be called before monitoring production data.
        """
        self.baseline_stats = {}
        for feature_name, values in data.items():
            values = np.array(values, dtype=float)
            valid = values[~np.isnan(values)]

            # Compute bin edges from baseline data
            bin_edges = np.percentile(
                valid,
                np.linspace(0, 100, self.n_bins + 1)
            )
            # Ensure unique bin edges (dedup if percentiles are equal)
            bin_edges = np.unique(bin_edges)

            # Compute baseline distribution
            baseline_dist = self._compute_distribution(valid, bin_edges)

            self.baseline_stats[feature_name] = {
                "bin_edges": bin_edges.tolist(),
                "baseline_dist": baseline_dist.tolist(),
                "baseline_mean": float(np.mean(valid)),
                "baseline_std": float(np.std(valid)),
                "n_samples": len(valid)
            }

        print(f"[DriftDetector] Baseline fitted on {len(data)} features.")
        for feature, stats in self.baseline_stats.items():
            print(f"  {feature}: {stats['n_samples']} samples, "
                  f"mean={stats['baseline_mean']:.3f}, std={stats['baseline_std']:.3f}")

    def _compute_distribution(
        self,
        values: np.ndarray,
        bin_edges: np.ndarray
    ) -> np.ndarray:
        """Compute normalized bin distribution with minimum bin floor to prevent log(0)."""
        counts, _ = np.histogram(values, bins=bin_edges)
        dist = counts / len(values)
        # Apply minimum bin size (prevents PSI = infinity for empty bins)
        dist = np.maximum(dist, self.min_bin_size)
        dist = dist / dist.sum()  # renormalize after flooring
        return dist

    def _compute_psi(
        self,
        baseline_dist: np.ndarray,
        current_dist: np.ndarray
    ) -> float:
        """
        Population Stability Index.
        PSI = sum((current_i - baseline_i) * ln(current_i / baseline_i))
        """
        return float(np.sum(
            (current_dist - baseline_dist) * np.log(current_dist / baseline_dist)
        ))

    def _classify_severity(self, psi: float) -> str:
        if psi < self.PSI_STABLE:
            return "stable"
        elif psi < self.PSI_WARNING:
            return "moderate_drift"
        else:
            return "significant_drift"

    def monitor(self, current_data: Dict[str, np.ndarray]) -> MonitoringReport:
        """
        Compare current production data distribution against baseline.
        Returns a MonitoringReport with PSI for each feature.
        """
        if not self.baseline_stats:
            raise RuntimeError("fit_baseline() must be called before monitor()")

        results = []
        drifted = []
        critical = []

        for feature_name in self.baseline_stats:
            if feature_name not in current_data:
                print(f"WARNING: Feature '{feature_name}' missing from current data")
                continue

            current_values = np.array(current_data[feature_name], dtype=float)
            current_valid = current_values[~np.isnan(current_values)]

            stats = self.baseline_stats[feature_name]
            bin_edges = np.array(stats["bin_edges"])
            baseline_dist = np.array(stats["baseline_dist"])

            current_dist = self._compute_distribution(current_valid, bin_edges)
            psi = self._compute_psi(baseline_dist, current_dist)
            severity = self._classify_severity(psi)

            result = DriftResult(
                feature_name=feature_name,
                psi=round(psi, 4),
                severity=severity,
                baseline_dist=baseline_dist.tolist(),
                current_dist=current_dist.tolist(),
                bin_edges=bin_edges.tolist()
            )
            results.append(result)

            if severity == "moderate_drift":
                drifted.append(feature_name)
            elif severity == "significant_drift":
                critical.append(feature_name)
                drifted.append(feature_name)

        # Overall status
        if critical:
            overall_status = "critical"
        elif drifted:
            overall_status = "warning"
        else:
            overall_status = "healthy"

        # Count samples
        sample_feature = next(iter(current_data))
        n_current = len(current_data[sample_feature])
        n_baseline = self.baseline_stats[next(iter(self.baseline_stats))]["n_samples"]

        return MonitoringReport(
            run_timestamp=datetime.now().isoformat(),
            n_baseline_samples=n_baseline,
            n_current_samples=n_current,
            feature_results=results,
            overall_status=overall_status,
            drifted_features=drifted,
            critical_features=critical
        )

    def print_report(self, report: MonitoringReport) -> None:
        """Print a human-readable monitoring report."""
        status_emoji = {"healthy": "✅", "warning": "⚠️", "critical": "🚨"}

        print(f"\n{'='*60}")
        print(f"DRIFT MONITORING REPORT — {report.run_timestamp[:19]}")
        print(f"Overall status: {status_emoji.get(report.overall_status, '')} {report.overall_status.upper()}")
        print(f"Baseline samples: {report.n_baseline_samples:,} | Current samples: {report.n_current_samples:,}")
        print(f"{'='*60}")

        # Sort by PSI descending
        sorted_results = sorted(report.feature_results, key=lambda r: r.psi, reverse=True)

        print(f"\n{'Feature':<25} {'PSI':>8}  {'Status':<20}")
        print("-" * 55)
        for r in sorted_results:
            severity_label = {
                "stable": "✅ Stable",
                "moderate_drift": "⚠️  Moderate drift",
                "significant_drift": "🚨 Significant drift"
            }[r.severity]
            print(f"{r.feature_name:<25} {r.psi:>8.4f}  {severity_label}")

        if report.critical_features:
            print(f"\n🚨 ACTION REQUIRED: {len(report.critical_features)} feature(s) with significant drift:")
            for f in report.critical_features:
                print(f"   — {f}")

        if report.drifted_features:
            print(f"\nRecommendation: Review feature distributions for {', '.join(report.drifted_features)}")
            if report.overall_status == "critical":
                print("Consider triggering model retraining or investigating data pipeline changes.")

    def save_baseline(self, path: str) -> None:
        with open(path, "w") as f:
            json.dump(self.baseline_stats, f, indent=2)
        print(f"[DriftDetector] Baseline saved to {path}")

    def load_baseline(self, path: str) -> None:
        with open(path) as f:
            self.baseline_stats = json.load(f)
        print(f"[DriftDetector] Baseline loaded from {path} ({len(self.baseline_stats)} features)")


# --- Example: simulating distribution drift ---

if __name__ == "__main__":
    np.random.seed(42)

    # Simulate baseline training data (3 features)
    n_baseline = 50000
    baseline_data = {
        "age": np.random.normal(42, 12, n_baseline),
        "income": np.random.lognormal(10.5, 0.8, n_baseline),
        "credit_score": np.random.normal(680, 75, n_baseline),
    }

    detector = DataDriftDetector(n_bins=10)
    detector.fit_baseline(baseline_data)

    # Scenario 1: Stable production data (no drift expected)
    print("\n--- Scenario 1: Stable production data ---")
    stable_data = {
        "age": np.random.normal(42, 12, 5000),           # same distribution
        "income": np.random.lognormal(10.5, 0.8, 5000),  # same distribution
        "credit_score": np.random.normal(680, 75, 5000),  # same distribution
    }
    report_stable = detector.monitor(stable_data)
    detector.print_report(report_stable)

    # Scenario 2: Drifted production data (e.g., new marketing campaign changed user demographics)
    print("\n--- Scenario 2: Drifted production data ---")
    drifted_data = {
        "age": np.random.normal(28, 8, 5000),            # younger population (significant drift)
        "income": np.random.lognormal(10.2, 0.9, 5000),  # slightly lower income (moderate drift)
        "credit_score": np.random.normal(680, 75, 5000),  # stable
    }
    report_drifted = detector.monitor(drifted_data)
    detector.print_report(report_drifted)

    # Show what actionable output looks like
    print("\n--- Operational decision ---")
    if report_drifted.overall_status == "critical":
        print("ACTION: Triggering retraining review.")
        print(f"Critical features: {report_drifted.critical_features}")
    elif report_drifted.overall_status == "warning":
        print("ACTION: Flag for ML engineer review. Continue monitoring for 3 consecutive days.")
    else:
        print("No action required. System healthy.")
Production Challenge 1: The CT Loop That Made Things Worse
The scenario:
A product team runs a CT (Continuous Training) loop for their content recommendation model. The loop retrains every Sunday using the past 30 days of interaction data. The new model is automatically promoted if its offline AUC exceeds the current production model.
Three months in, the team notices a pattern: the model is being retrained every week. AUC stays roughly flat (±0.002). But over eight weeks, the model's diversity metrics have steadily degraded — it now recommends the same 200 pieces of content to 70% of users. The model has gotten better at predicting what users clicked on and worse at serving the product's diversity goals.
The challenge:
- What structural property of the CT loop caused this degradation, and what is its name in the ML literature?
- What change to the training data strategy would break this cycle?
- The team wants to add a diversity metric as a quality gate. Design the gate: what it measures, what threshold triggers a fail, and what the remediation path is.
- What changes to the CT trigger strategy (moving away from fixed weekly retraining) would help?
Expert thinking
1. The feedback loop causing the degradation:
This is distribution shift caused by the model's own predictions — sometimes called a closed-loop feedback effect or exposure bias in recommendation systems. The CT loop creates a self-reinforcing cycle:
- The model recommends popular content
- Users click popular content (because it was recommended, not necessarily because it's best)
- The next retraining dataset is dominated by clicks on popular content
- The new model learns even more strongly that popular content is what users want
- Diversity collapses further
In the bandit/recommendation literature, this is related to filter bubble formation through model self-training. The model has no counterfactual data — it has no signal about what users would have clicked if they had been shown different content. It optimizes on the interaction data it generates, which reflects its own past recommendations.
2. Breaking the cycle: counterfactual data injection
The most direct fix is exploration injection: in production, serve a small fraction (5–10%) of traffic with random or diverse content recommendations (epsilon-greedy or Thompson Sampling exploration). These "exploration" impressions and their resulting clicks are logged separately and included in the retraining dataset.
This provides counterfactual data: the model learns what users click on content it would not have otherwise recommended. Over time, the training distribution reflects actual user preferences across the content catalog, not just the preferences the model reinforced.
An alternative: inverse propensity score (IPS) weighting in the training loss. Downweight training examples from content that the model assigned high probability to (these are over-represented in the training data); upweight examples from content the model assigned low probability to. This corrects for the self-reinforcing bias without requiring explicit exploration traffic.
3. Diversity quality gate:
What it measures: Intra-list diversity (ILD) — the average pairwise content distance within each recommendation list. Concretely: for a list of 10 recommended items per user, compute the average embedding distance between all pairs. A diverse list has high average pairwise distance; a filter-bubble list has low average pairwise distance.
Operationally simpler proxy: catalog coverage at k — the fraction of the content catalog that appears in at least 1% of recommendation lists. A model that concentrates 70% of recommendations on 200 items has a catalog coverage of approximately 200/total_catalog.
Gate threshold:
- Catalog coverage must be ≥ baseline × 0.90 (the new model must cover at least 90% of the baseline's catalog coverage)
- If baseline catalog coverage was 8% (400 items recommended regularly), the new model must cover ≥ 7.2% (360 items)
Remediation path:
- If the diversity gate fails: do NOT auto-promote. Surface the failure with a comparison of the diversity metrics between the candidate and the current production model. Require human review before promotion.
- If the same model fails the diversity gate for 3 consecutive weeks: trigger a full review of the training data strategy. The retraining loop itself is generating training data that systematically degrades diversity — this is a structural problem, not a one-off.
4. CT trigger improvements:
Move away from fixed weekly retraining:
The fixed weekly schedule means the model retrains even when data quality or distribution is stable and even when the previous retraining made things worse. Alternative triggers:
-
Quality-gated trigger: Only retrain when the rolling 7-day AUC (on a held-out set with labels) falls below a threshold. If the model is still performing well, retraining is unnecessary and risks introducing the feedback loop amplification.
-
Diversity-triggered retraining: If catalog coverage metric drops below a threshold (e.g., 80% of baseline), trigger a special retraining run with exploration-augmented data, not the standard loop.
-
Exploration-first trigger: Before each scheduled retraining, verify that the training dataset contains at least 10% exploration traffic impressions. If the exploration fraction is below 10%, the CT loop is blocked until sufficient exploration data accumulates. This ensures the feedback loop is structurally broken before the model retrains.
Production Challenge 2: Diagnosing the Three-Moving-Parts Failure
The scenario:
A fraud detection model's performance is reviewed quarterly. The Q3 review shows:
- Overall precision: 0.91 (same as Q2)
- Overall recall: 0.78 (same as Q2)
- False positive rate on mobile new user accounts: increased from 4.2% to 11.3% over the quarter
The model has not been retrained since Q1. The data engineering team has not changed the feature pipeline. No code has been deployed to the serving layer in Q3. The business team is escalating the mobile new user false positive issue.
The challenge:
Using the three-moving-parts framework, diagnose the most likely root cause. For each of the three components, identify: (a) whether it could have changed without a team making an intentional change, (b) what specific evidence you would look for, and (c) what the fix looks like.
Expert thinking
Code: Can change without intentional deployment — through dependency updates in container rebuilds, base image updates, library version upgrades that occur as part of scheduled security patching. Check: container build timestamps for the serving environment in Q3. Check: Python and scikit-learn (or equivalent) version in the Q3 container vs Q2. If a serving library updated its feature computation (e.g., a change in how a datetime feature is computed, a change in how NaN values are handled in a scaling step), the feature values the model receives at serving time may have shifted without any explicit code change.
Specific evidence: compare serving container build dates to the timing of the false positive rate increase. Pull a sample of Q3 mobile new user feature vectors and compare the distribution to Q2 feature vectors for the same cohort.
Data: Most likely root cause. "New user mobile accounts" is a segment that can change composition dramatically without any pipeline change. In Q3:
- New mobile user acquisition channels may have launched (paid mobile ads, partnership referrals, new market expansion)
- New device types or operating system versions may be generating different behavioral signals
- New users from these channels have different feature profiles than the Q1 training population
The feature pipeline is unchanged — it still computes the same features. But the mobile new user population flowing through it has shifted. The model was trained on Q1 mobile new users. Q3 mobile new users have a different distribution of device age, session length, behavioral velocity, and transaction patterns. The model's learned boundary for "mobile new user fraud risk" no longer matches the actual distribution.
Specific evidence: Pull feature distributions for mobile new user accounts in Q3 vs Q1 (training period). Calculate PSI for each feature in this segment. If PSI > 0.1 on key features, the distribution has shifted.
Model: The model has not been retrained — but its effective performance can degrade without any change to the model artifact itself if the feature inputs change (above). The model is unchanged; its predictions are no longer calibrated for the Q3 mobile new user population.
Specific evidence: The model's predicted probability scores for mobile new user accounts in Q3 vs Q1 — has the score distribution shifted? Are Q3 mobile new users systematically receiving lower fraud probabilities (leading to more false negatives) or higher probabilities (leading to more false positives)? Given the symptom is increased false positives, the model may be assigning higher fraud scores to a new cohort of legitimate users.
Most likely root cause and fix:
Data distribution shift in the mobile new user segment is the most likely cause. The fix:
- Immediate: adjust the decision threshold for the mobile new user segment specifically. A segment-specific threshold is a bandage, not a cure, but it reduces false positives while the root cause is addressed.
- Structural: retrain with Q3 data that includes the new mobile user population. Add the mobile new user segment to the quality gate evaluation — the gate must check segment-level false positive rate, not just aggregate metrics.
- Preventive: add segment-level distribution monitoring. The aggregate PSI was stable (Q2 and Q3 overall metrics are unchanged), but the mobile new user sub-segment drifted. Monitoring must be done at segment level, not just overall.
Applied Interview Questions
Q1. What are the four automation loops in MLOps? Explain each in one sentence and explain why their order matters for building them.
Expected answer
CI catches code, data, and training logic errors on every change before they reach production. CD safely releases pipeline and serving changes across environments. CT triggers retraining automatically when defined conditions are met. CM detects model and data quality degradation early and routes to corrective action.
Order matters because each loop depends on the previous one being stable. You cannot automate deployment (CD) safely until you can reliably test what you're deploying (CI). You cannot automate retraining (CT) safely until you can reliably deploy the retrained model (CD). You cannot act on monitoring signals (CM) reliably until the retraining and deployment they trigger are automated (CT + CD). Teams that try to build CT before CI end up automating retraining on untested pipelines — they accelerate the propagation of bugs, not the improvement of models.
Q2. Explain training-serving skew. What causes it, how do you detect it, and how do you prevent it?
Expected answer
Training-serving skew: the features the model receives at serving time are computed differently from the features used during training, causing the model to underperform in production despite strong offline metrics.
Causes: (1) Feature logic is implemented twice — once in the training pipeline (Python/Spark) and once in the serving layer (Java/C++) — and the implementations diverge. (2) Training data is joined with features from a point-in-time snapshot; serving computes features in real time, and the real-time computation differs slightly. (3) A feature available in the offline training dataset is unavailable, delayed, or approximate at serving time. (4) A data preprocessing step (scaling, encoding) is applied in training but missing or different at serving.
Detection: Log production feature values and compare their distribution to the training set distribution using PSI or KS test. If feature distributions differ significantly, skew is present. More directly: shadow the serving pipeline by logging raw inputs, running them through both the training pipeline and the serving pipeline, and comparing outputs.
Prevention: Share the feature computation logic between training and serving — a single codebase, not two implementations. Feature store: offline features for training and online features for serving computed by the same transform logic. Integration tests: run the same input through both pipelines and assert the outputs are identical within floating-point tolerance.
Q3. A model was retrained last week. Prediction quality dropped by 8% in online metrics. The data engineer says the training data is the same. The ML engineer says the model code is the same. Who do you believe, and what do you investigate first?
Expected answer
Both can be truthful and the quality can still have dropped — this is the three-moving-parts problem. "Same training data" typically means the same pipeline ran — not that the data flowing through the pipeline produced the same output. "Same model code" means the training script is unchanged — not that the trained model is identical to last week's.
Investigate in this order:
-
Compare the trained artifacts directly. Are the model weights meaningfully different from last week's? If yes, something changed during training even if the code is "the same." Check: random seed pinned? Library version identical? If the random seed was not pinned, the model trained to a different local optimum.
-
Compare training data feature distributions. Pull the actual feature values from last week's training run vs this week's. The pipeline code may be identical, but the data it processed may have different distributions if the upstream data source changed. Calculate PSI on each feature.
-
Check the environment. Did any dependency update between last week and this week? A scikit-learn patch release that changes default behavior in a transformer, or a numpy update that changes floating-point computation, can produce different model outputs from identical code and data.
-
Check the validation set. Did the held-out validation set change between runs? If the validation data distribution shifted, an 8% drop in online metrics with stable offline metrics suggests the offline evaluation is no longer representative of production.
The most common root cause for "same code, same data, worse model": an unpinned dependency updated between training runs, or the training data time window shifted and included a different distribution than the previous week's window.
Q4. What is a model registry, and what metadata should it store? Who reads from it and for what purpose?
Expected answer
A model registry is a versioned catalog of trained model artifacts — a source of truth for what is or has been in production, what produced each artifact, and whether each artifact has been validated.
Required metadata per registered model:
- Artifact path and hash (SHA256 of the artifact file — proves the artifact has not been modified)
- Training code commit (git hash or equivalent)
- Training data description: date range, row count, data source version
- Feature definition version: which version of feature transform code produced the training features
- Hyperparameters used
- Validation metrics: the full evaluation results including per-segment metrics
- Quality gate results: which gates passed and which failed
- Environment: Python version, key library versions used in training
- Lineage: which pipeline run produced this artifact
- Stage transitions: Candidate → Staging → Production → Archived, with timestamps and approver
Who reads from it:
- Deployment system: reads to determine which model version to promote to serving; reads the artifact path and hash to verify integrity before deployment
- Monitoring system: reads to correlate performance degradation with the model version currently serving; reads to know when to compare current metrics against the registered baseline metrics
- Audit/compliance team: reads to produce evidence of which model version made decisions on which dates; reads model cards for regulatory review
- Data scientists and ML engineers: reads to compare candidate models against the current production model; reads to understand what data and code produced any historical model
Q5. When should a team move from Level 1 to Level 2 MLOps maturity? What evidence would you require before recommending the transition?
Expected answer
Level 2 (full CI/CD for pipelines and models) is justified when Level 1 operations create measurable bottlenecks that cannot be resolved by improving Level 1 execution.
Required evidence before recommending the transition:
-
Level 1 gates are trusted. Automated quality gates at Level 1 have been running for at least 4–6 weeks and have a demonstrated track record: they catch real issues without excessive false positives. If the team does not trust the gates, automating deployment based on them adds risk.
-
Coordination overhead is measurable and material. Each model promotion requires more than 2 hours of engineer time (including coordination, review, and manual steps). With 5+ models retraining weekly, this creates 10+ hours of overhead per week. This is the business case for automation.
-
Rollback is fast and tested. Before automating deployment, verify that rollback to the previous production model takes < 10 minutes and has been tested at least twice. Automated promotion without fast rollback is dangerous.
-
Incident rate is stable. The team has not had more than one production incident from a model promotion in the past 60 days. Automating promotions on an unstable system amplifies instability.
-
The team has a dedicated platform resource. Level 2 systems require ongoing maintenance — pipeline CI, deployment automation, quality gate calibration. Without at least 0.5 FTE of platform-oriented engineering capacity, the automation will decay faster than it adds value.
Without all five conditions, the better investment is typically strengthening Level 1 discipline rather than advancing to Level 2 tooling.
Q6. Describe three scenarios where the MLOps maturity level of a team's infrastructure is higher than the discipline of the team using it. What happens in each case?
Expected answer
Scenario 1: Automated promotion gates that nobody calibrated. A team builds a Level 2 CI/CD pipeline with automated quality gates. The gates are set at arbitrary thresholds (e.g., "AUC ≥ 0.75") that were not derived from analysis of the business impact of different quality levels. The gate passes models that are technically above threshold but are subtly wrong in ways the threshold does not capture — like a model with 0.76 AUC that has 30% recall on the highest-stakes segment. The automation promotes this model; the business impact is not visible until a downstream incident.
Scenario 2: Continuous Training without monitoring. A team sets up a CT loop that retrains every week. They do not have CM (Continuous Monitoring) in place to tell them when retraining is needed or whether the new model is actually better in production. The CT loop runs regardless of whether the model is degrading. In a week where the training data contains a corrupted batch, the loop retrains on the corruption and automatically promotes a worse model. The feedback from monitoring that would have blocked this promotion does not exist.
Scenario 3: Feature store without feature ownership. A team deploys a feature store and adds dozens of features from multiple teams. Nobody assigns ownership to individual features — nobody is responsible for monitoring freshness, detecting staleness, or deprecating unused features. Six months in, the feature store contains features that are no longer being updated (stale), features with no documented meaning, and features that overlap with each other in undocumented ways. The tool is Level 2; the data governance practice is Level 0.
In all three cases, the team has the infrastructure of a higher maturity level without the operational discipline to use it safely. The infrastructure does not create the discipline — it amplifies whatever practices the team already has.
Q7. What is an ADR (Architecture Decision Record)? Give a concrete example of an MLOps decision that should be documented in one, including what the record should contain.
Expected answer
An ADR is a short document recording a significant architectural decision: the context that forced the decision, the decision made, the consequences (trade-offs and operational impact), and the alternatives that were considered.
ADRs solve the "why does it work this way?" problem. Without them, architectural decisions exist only in the memory of the engineers who made them. When those engineers leave, the decision is re-litigated from scratch — often making the same choice after the same debate, or making a different choice without understanding why the original was made.
Concrete MLOps example: "Decision to use batch serving instead of online serving for the churn model"
Context: The churn prediction model needs to serve scores for ~500,000 users daily. Initial design assumed online serving (REST API endpoint). The team discovered that 95% of use cases (email campaigns, account manager dashboards) need scores once per day in aggregate, not in real time. The remaining 5% (in-app retention offer) needs a score within 200ms.
Decision: Use batch serving as the primary serving mode. The training pipeline runs overnight and deposits scores to a database. The email and dashboard use cases read from the database. For the in-app use case, implement a score cache populated by the batch job — the in-app call reads from cache, not from a live model endpoint.
Consequences: Removes the need for a model serving endpoint and its associated SLO/latency/infrastructure overhead. Introduces a 24-hour staleness constraint — the in-app retention offer uses yesterday's score. If a user's churn risk changes dramatically intraday, the in-app offer may be based on stale information. Adds the cache invalidation responsibility.
Alternatives considered: (a) Online serving for all use cases — rejected because it requires a serving infrastructure (autoscaling, latency SLOs, redundancy) that is disproportionate to the marginal benefit of real-time scores for 95% of use cases; (b) Online serving only for the in-app use case with batch for others — rejected because maintaining two serving paths doubles the operational surface area.
Q8. A data scientist claims "our model's offline AUC improved by 4% after retraining." An engineer says "production click-through rate hasn't changed in two weeks." Are these measurements contradictory? Which do you trust, and what do they each tell you?
Expected answer
They are not contradictory — they measure different things. The apparent contradiction is the classic symptom of a misaligned framing stack (Chapter 1.1). Understanding both measurements together is more valuable than choosing one to trust.
AUC (offline model metric): Measures how well the model ranks examples in the held-out validation set — relative ordering of predicted scores. Improved AUC means the model is better at distinguishing positive from negative examples in the historical dataset it was evaluated on. It does not prove the validation set is representative of current production data, it does not prove the model's improvement translates to the specific product interaction being measured (clicks), and it does not prove the decision policy (threshold, ranking mechanism) is capturing the model improvement.
Click-through rate (business/product metric): Measures a downstream product behavior, not model quality directly. CTR could be unchanged because: (a) the model improvement is not large enough to move CTR given the noise in the product, (b) the decision policy (ranking, threshold) is not surfacing the model's improved rankings to users, (c) other product factors dominate CTR and swamp the model signal, (d) the AUC improvement was on a segment or distribution not representative of the users who determine CTR.
Which to trust: Trust both, but for different purposes. AUC tells you the model is objectively better at its prediction task. CTR tells you whether that improvement translated to product impact. The question to investigate is why the AUC improvement did not move CTR — the answer usually reveals something about the decision policy, the measurement window, or the alignment between the model objective and the business metric.
Q9. What are the three collaboration models for MLOps teams? A company has 8 data scientists, 1 ML engineer, 3 models in production, and plans to grow to 10 models within 12 months. Which model would you recommend, and what is the transition trigger to change models?
Expected answer
The three models:
-
Separate DS + Platform/Ops: Data scientists and platform/infrastructure engineers are distinct teams. Platform builds and maintains the ML infrastructure; DS/MLE builds models on top of it. Clean ownership, but slow handoffs and friction in debugging.
-
Full-stack DS/MLE: Each data scientist owns their model from development to production. Fast iteration, tight feedback loops. Brittle at scale — depends on individual DS having full-stack skills; operational responsibility fragments across the team.
-
Hybrid platform-enabled: A small platform team (1–2 engineers) maintains shared infrastructure and golden paths. DS/MLE use the platform for standard workflows, with escape hatches for non-standard needs. Platform team's mandate: make the right path the easy path.
Recommendation for this team: Begin transitioning to hybrid platform-enabled now.
Current state (8 DS, 1 MLE, 3 models) is at the edge of sustainable full-stack operation. The 1 ML engineer is likely a single point of failure for all three production models. With 10 models in 12 months, the full-stack approach will break — 10 models owned individually across 8 data scientists with one operational engineer creates unmanageable coordination overhead and inconsistent practices.
The hybrid model does not require hiring a large platform team. The current ML engineer, with direction from the team, can begin building shared infrastructure components: a standardized training pipeline template, a shared model registry, a shared deployment mechanism. These become the "golden paths" that data scientists use by default.
Transition trigger: When the current ML engineer is spending > 50% of their time on operational overhead (deployments, debugging production issues, running notebook-based retraining for other data scientists) rather than building models, the team has exceeded the capacity of the full-stack model. At that point, platform investment has a clear business case.
Q10. Walk through the complete checklist for what you would verify before a model is deployed to production — treating each item as a specific question with a yes/no answer required.
Expected answer
A complete pre-production deployment checklist:
Reproducibility:
- Can this model be reconstructed from its lineage record (code commit + data snapshot + params + environment)?
- Is the artifact hash recorded and verified?
Quality gates:
- Has the model met the metric floor threshold on the held-out validation set?
- Has the model been evaluated on all important data segments (not just overall metrics)?
- Have fairness and compliance checks passed (if required by the domain)?
- Has latency been profiled at expected peak load? Does it meet the p99 SLO?
Deployment readiness:
- Is there a current production model to roll back to? Is that rollback tested and < 10 minutes?
- Is the serving infrastructure tested at the expected load?
- Are the monitoring signals (system, data, model, business KPI) in place and alerting correctly?
Operational ownership:
- Is there a named on-call engineer for this model?
- Does that engineer know how to execute a rollback?
- Is there a runbook for the most likely failure modes (serving error, quality degradation, data pipeline failure)?
Governance:
- Is prediction logging in place for audit purposes?
- Are the model card and lineage record complete and stored in the registry?
- Has the promotion been approved according to the documented promotion policy?
If any item is "no," the model should not be promoted until the gap is resolved. The checklist is not bureaucracy — each item corresponds to a documented production failure mode.
Sources
- Sculley, D. et al. "Hidden Technical Debt in Machine Learning Systems." NeurIPS, 2015. (The canonical reference for ML system complexity and the 5:95 model-to-system ratio)
- Huyen, Chip. "Designing Machine Learning Systems." O'Reilly, 2022. (Production ML lifecycle and the three-moving-parts problem)
- Burkov, Andriy. "Machine Learning Engineering." Andriy Burkov, 2020. (Reproducibility requirements and the six versioned components)
- Fowler, Martin & Humble, Jez. "Continuous Delivery for Machine Learning." martinfowler.com, 2019. (CD4ML — the original framing of CI/CD/CT/CM for ML)
- Netflix Tech Blog. "Supporting Diverse ML Systems at Netflix." 2024.
- InfoQ. "Netflix Uses Metaflow to Manage Hundreds of AI/ML Applications at Scale." March 2024.
- QCon SF 2024. "Using Metaflow to Support Diverse ML Systems." InfoQ, November 2024.
- Gebrim, Josue Luzardo. "Do Not Use Kubeflow!" Medium, 2023.
- ZenML. "8 Alternatives to Kubeflow for ML Workflow Orchestration." ZenML Blog, 2023.
- Weights & Biases. "State of MLOps 2024." WandB Report, 2024. (67% of teams discover model issues via business metrics)
- Siddiqi, Naeem. "Credit Risk Scorecards: Developing and Implementing Intelligent Credit Scoring." Wiley, 2006. (Population Stability Index thresholds and interpretation)
- Google. "Practitioners Guide to MLOps: A Framework for Continuous Delivery and Automation of ML." Google Cloud, 2021.
- LinkedIn Engineering. "Scaling Machine Learning Productivity at LinkedIn." January 2019.
- Uber Engineering. "Meet Michelangelo: Uber's Machine Learning Platform." 2017.
- Uber Engineering. "Scaling Machine Learning at Uber with Michelangelo." 2019.